2012 Outlook Five themes that will drive financial markets in 2012
Coming out of the worst financial crisis and recession since the Great Depression, the U.S. economy has now expanded for nine quarters in a row. Economies are also still growing in the emerging countries, in developed Asia, and–so far–Europe. Since the stock market bottom in March 2009, the S&P 500 has risen 84%. Yet it scarcely feels like a recovery, or an environment that is friendly to stocks. Growth in the United States was disappointing in 2011. The consensus among economists surveyed by the Philadelphia Fed in early 2011 was that real GDP would grow by 3.2%. Instead, the economy expanded at an annualized rate of only 1.2% in the first three quarters of 2011. The unemployment rate remains stuck at 9%, with 13.1 million unemployed as of October 2011–a third of them for more than a year. The economic weakness has been good for bondholders, with prices rising as yields on 10-year U.S. Treasuries are dropping below 2%. But the stock market–despite record corporate profits–has been extraordinarily volatile. Amidst mixed economic news and political paralysis, the S&P 500 is essentially flat (down 1%) for the year.
Exhibit 1
Global growth: Still positive, but slowing | 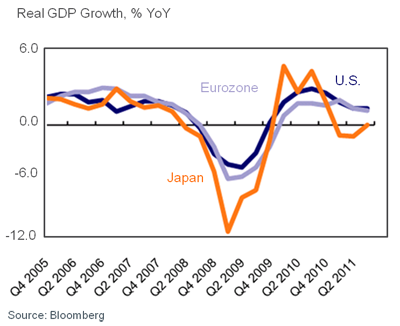
|
Exhibit 2
2011: Great for bonds, not for stocks | 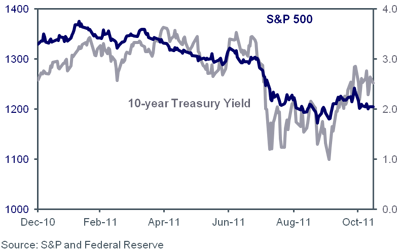 |
Five themes for the year ahead
In this difficult climate for investing, it is natural to ask what developments will be crucial in determining performance in the coming year. What catalysts would spark a rise in the markets? What investments are the most attractive in a volatile, post-crisis, slow-recovery world? At Cetera Research we believe five developments will be critical in determining investment returns in 2012: - The pace of the global economic recovery.
- Fiscal consolidation and debt reduction–on both sides of the Atlantic.
- Inflation (or its absence).
- Market volatility.
- The U.S. presidential election.
This report takes a look at each one in turn–and their implications.
THEME 1: The pace of the global economic recovery
In gauging the prospects for growth, it is useful to take a building block approach and look at the sectors that make up GDP. These are consumption, investment, government spending, and trade (net exports). Growth must come from one or more of these sectors.
It is natural to start with personal consumption expenditures, which account for about 70% of GDP. One would expect that after the sharp drop in home prices in recent years consumers would be retrenching, and they have been. The savings rate rose sharply after the 2008-09 crisis and recession, as households took money out of current income to replenish their net worth. This meant less spending. But in recent months, despite economic headwinds, consumers have stepped up their spending a bit. In October, retail sales rose at an annualized rate of 6%, beating economists’ forecasts. Consumer confidence rose in November, but is still well below levels that in the past have signaled robust growth, largely because of continuing concerns about employment. Meanwhile, chain store sales rose in line with expectations in November–but no better–despite reports of strong Black Friday sales. The outlook for consumer spending, in our view, is for more of the same: Modest growth in spending.
It used to be that business cycles in the United States could be explained mainly by fluctuations in investment spending, and in residential investment in particular, but no longer. The housing sector, faced with a large inventory of unsold homes and mounting foreclosures, has played no part in this recovery. Residential investment, which as recently as 2004 accounted for 4% of GDP, is now down to only 1.5%. Fortunately, business investment in equipment has helped take up the slack. Even though U.S. corporations are sitting on record holdings of cash–much of it held abroad for tax reasons–business investment has been surprisingly strong. This year, business investment in equipment is on track to grow by about 11%.
Exhibit 3
Housing: missing in this recovery | 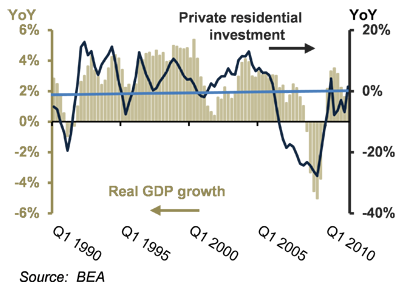 |
A widespread perception seems to exist that government spending has been growing rapidly and uncontrollably, perhaps because the budgetary debates in Congress have focused on ballooning entitlement spending projected for coming years. Government spending, however, has been contracting, with much of the decline accounted for by state and local governments that are retrenching as the 2009 federal stimulus funds expire. In the first half of 2011, total government spending declined at a 3.4% rate, enough to take 0.75% off of GDP growth. Unless Congress and the Administration are able to agree on a new long-term budget plan, large spending cuts will be automatically triggered, which will be a new drag on growth.
Exhibit 4
Government spending is declining | 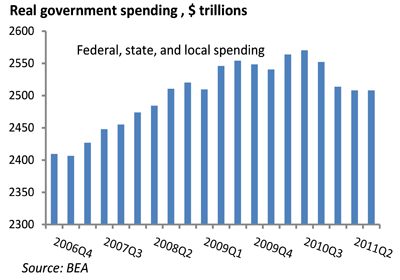 |
Perhaps the brightest spot in the economic recovery has been international trade, a sector that was more than pulling its weight even before the last recession. A falling dollar–down 34% since 2000–has made U.S. exports more competitive while strong global growth has boosted demand. Net exports have risen by $324 billion in real terms since the housing market peaked in 2006, offsetting about three quarters of the decline in residential investment. It is not clear, however, that this export performance can be sustained. Global growth is decelerating, led by slowdowns in Europe and China, and the dollar has been flat when measured against the currencies of the major trading partners of the United States since 2007.
Exhibit 5
International trade has helped offset the decline in housing | 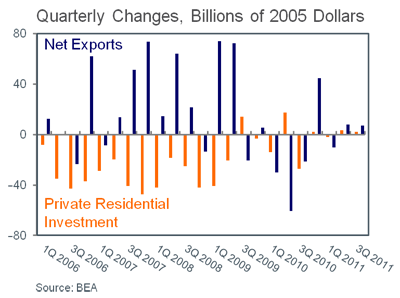 |
Putting it all together, the outlook for growth in 2012 is mixed. Most economic indicators in recent weeks have been positive. They do not add up to a robust economic recovery, but they also do not point to the recession that some feared last summer. The most likely outcome, in our view, is moderate growth–trend-like at best–for the coming year. As recently as the beginning of 2011, economists were inclined to view the current recovery mostly as an instance of a weaker-than-normal business cycle. Slowly, however, a consensus is building that the tepid growth in the United States and Europe instead reflects the tendency of economies throughout history to experience several years of sluggish growth, rising debt burdens, and political turmoil in the years after a severe financial crisis. The 2008-09 crisis was a long time in the making, and there seems to be every reason to believe it will take a long time to resolve.
THEME 2: Fiscal consolidation and debt stabilization
Facing large budget deficits and rising debt burdens in the wake of the 2008-09 financial crisis and recession–and rapidly aging populations–governments in the United States and Europe are planning deep spending cuts and, possibly, increases in tax revenues. Few doubt that in the medium term, budget deficits need to be brought under control and government debt stabilized. In the United States, for example, the Congressional Budget Office projects that under current law, the federal budget deficit will decline gradually from 9.8% of GDP in 2011 to 3.2% by 2019.
At that rate, however, debt would rise to over 75% of GDP and continue growing. If current laws are changed to include making the Bush-era tax cuts permanent and restoring many of the automatic spending cuts currently slated to expire, deficits and debt levels will be even higher. No country, of course, can service an ever-rising debt burden.
Trying to assign blame for the budget deficits and debt is, at this point, fruitless. Government debt has been rising along a more-or-less exponential path since the 1970s, slowly at first and faster more recently. It has risen during both Democratic and Republican administrations. The debt-to-GDP ratio–the metric that matters–was at about its post-war average until the last recession, when automatic government spending stabilizers kicked in as revenues fell. The increase in that ratio projected for coming years, however, cannot be attributed to the last recession.
The outlook for fiscal consolidation and debt stabilization in the United States, however, may not be quite as dire as current projections suggest. Edward Lazear, Chairman of the CEA under George W. Bush, has noted that if spending increases were held to the last three years’ inflation rate minus 1% in any year spending tops its 30-year average (18% of GDP), fiscal ratios would return to 2008 levels without tax increases. Alternatively, if current laws stay in place (tax rates rise to pre-2008 levels) and spending increases were limited to the inflation rate, fiscal ratios would also fall to sustainable levels. These calculations do not take into consideration the practical difficulties in restraining Medicare expenditures in the face of an aging population and medical costs that are rising faster than inflation, or limiting defense expenditures that are deemed necessary for national security. But they do help put the problems in perspective.
The question for investors is whether Congress and the Administration can agree on measures to reduce the budget deficit without front-loading spending cuts or tax hikes that would choke off the current anemic recovery. The stock market reacted negatively and sharply to the inability of Congress to reach agreement on budgetary issues in 2011, and to the S&P downgrade of the U.S. credit rating. Resolution of these issues may have to wait until the next presidential and congressional elections in November 2012.
Government borrowing costs have been rising across Europe, meanwhile, as the bond market has become skeptical that its debt crisis can be resolved. Europe’s debt problems, if anything, appear more serious than those of the United States because they threaten the future of the euro as a common currency and the viability of the European Union. Europe’s debt problems appear especially intractable because they involve questions of who will bear the costs of resolving the crisis. Who will bear the losses that result from a default on any European sovereign debt? Will it be the bondholders, taxpayers, pensions, or banks? Resolution of the debt crisis will require some loss-sharing agreement, and perhaps inevitably, some transfers of resources among the affected countries. Most observers now agree that saving the euro will require that the European Monetary Union must have a common fiscal policy to ensure that future bailouts are not necessary. Ultimately, these are questions that require a political solution, which no one imagines will be easy. At this juncture, however, agreement has been reached that bondholders will share in the losses in the event of a default by Greece, and proposals are being considered that would establish new rules for fiscal policy in the European Monetary Union.
Exhibit 6
Yields have been rising on European bonds | 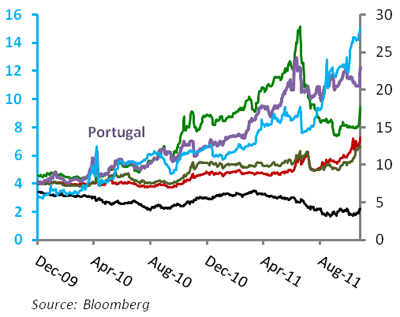 |
THEME 3: Will inflation return?
Inflation concerns–dormant during most of the past decade–came to the forefront again in 2011 as commodity prices rose. After peaking at a 3.8% rate in August, headline CPI inflation declined to 3.5% in October. Core inflation (which excludes food and energy), however, has remained near 2%. This is mainly because workers have not demanded higher wages: Hourly earnings in November’s labor report rose at a rate of only 1.8% more than a year ago, so production costs have remained subdued. Although few economists believe that wage and price inflation is inversely related to unemployment in a mechanical way, inflation does tend to be muted when resource utilization is below potential, as it has been in the United States since the 2008-09 recession.
Both the Fed and private forecasters see inflation subsiding in coming months as commodity prices decline as the economy continues to operate at less than full capacity. Central banks around the world, however, are flooding financial markets with liquidity, which they cannot do forever without raising prices. The bond market, for one, does not believe inflation will be low indefinitely. Judging from the yields on nominal U.S. Treasury bonds and inflation-adjusted bonds (TIPS), the U.S. Treasury market is currently pricing in an average inflation rate of about 2% over the next 10 years. Hidden in that average, however, is a gradual rise in inflation, to over 3% in five years beginning in 2017. Respondents to the most recent Michigan Consumer Sentiment survey are less optimistic about the near term, expecting a 3.2% inflation rate over the next year, though they see inflation abating to an average rate of 2.7% over the next five years.
Exhibit 7
Slack in the economy is keeping core inflation down | 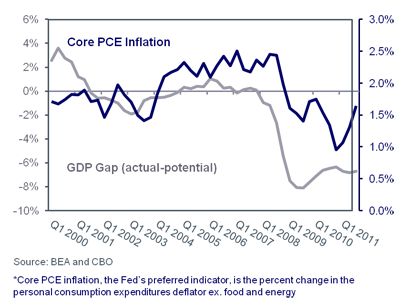 |
THEME 4: Will the stock market remain volatile?
Volatility in the stock market in recent months, with 250-point up or down days in the Dow Jones Industrial Average not uncommon, has exasperated investors. The widely-watched VIX indicator of future volatility in the S&P 500 implied by options prices has been unusually high, averaging 33 since in the second half of this year. Its historical average is about 21, though it rose to 80 at the height of the financial crisis in October 2008. The VIX can be viewed as an index of fear in the market, or of the uncertainty about future outcomes. The sources of the recent volatility are not hard to fathom: News of a weakening U.S. economy between May and August of 2011, followed by news that the economy had some momentum after all, political paralysis on debt issues in the United States and Europe, a full-blown debt crisis in the Eurozone, and evidence of an impending slowdown in China and Europe. But the stock market has also responded positively and enthusiastically to news of actions to alleviate Europe’s debt crisis, such as the 490-point surge in the Dow Jones Industrial Average on November 30 in response to news that central banks around the world were acting to make it less costly for European banks to borrow. When will the market volatility subside? When there is more visibility on the resolution of the budgetary and debt issues in the United States and Europe, and when there is evidence that the post-crisis sub-par growth is coming to an end. It is possible that will occur in 2012, but it is not our baseline forecast.
Exhibit 8
The VIX index is signaling fears of continued volatility | 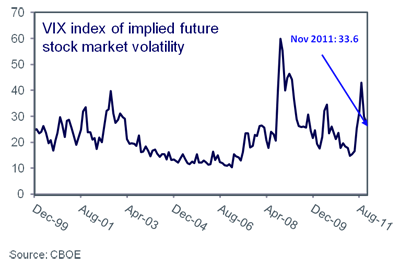 |
THEME 5: The U.S. presidential election
It is not hard to think of ways in which the outcome of a presidential election could affect the stock market, especially if it is accompanied by a change in party control in Congress. Many laws and policies could change, including tax laws, securities laws, federal spending, environmental protections, and foreign policy. All of these could in turn affect corporate profits and valuations, and hence returns in the stock market.
Researchers have had some success in forecasting the outcome of presidential elections. On-line prediction markets, meanwhile, appear to be at least as accurate as other methods of forecasting elections. The real-money Iowa Electronic Market (IEM) run by the University of Iowa business school, for example, proved more accurate than pollsters in forecasting the outcome of four elections 75% of the time. As of this writing, voting in the IEM has unnamed Democratic and Republican presidential candidates in a virtual dead heat in vote shares, with the unnamed Democratic candidate slightly ahead in a winner-take-all vote.
Predictions of election outcomes aside, success in explaining the market’s reaction to presidential elections has confounded researchers. Bull markets, for example, have followed a change of presidency and party control of Congress, but also a change of presidency that has not been accompanied by a change in control in the legislative branch. There is little doubt that stock markets tend to fare much better under Democratic presidents–returns have on average been 9% higher during 1927-2003 under Democratic administrations. Explaining why, however, has proven difficult indeed. Financial theorists are inclined to attribute any excess return to a risk premium, but to quote the conclusion of UCLA researchers, “There is no difference in the riskiness of the stock market across presidencies that could justify a risk premium.”
Exhibit 9
Market performance by president | | | | ADMINISTRATIONS | AVERAGE RETURN, %* |
|---|
| Truman | 1945-1952 | 8.6 | | Eisenhower | 1953-1960 | 10.2 | | Kennedy–Johnson | 1961-1968 | 7.5 | | Nixon–Ford | 1969-1976 | 0.3 | | Carter | 1977-1980 | 6.6 | | Reagan–G.H. Bush | 1981-1992 | 10.4 | | Clinton | 1993-2000 | 15.0 | | G.W. Bush | 2001-2008 | -5.8 |
| | | *Average compound growth rate of S&P 500
Source: S&P and Cetera calculations |
Some market participants will no doubt wager on an election outcome in November 2012. Absent a credible explanation for how or why the stock market responds to presidential elections, however, it is hard to recommend that investors take a view that might involve cash outlays.
How to Potentially Profit and Protect in 2012
Over the long-term, we believe a strategically diversified approach works well regardless of market environment. However, with 2012 and beyond looking like a volatile market environment characterized by weak economic data and increased uncertainty, the question for investors is what to do now. We believe these investment opportunities offer the ability to both protect and profit in the financial markets goaded by the aforementioned themes.
An allocation to stocks. Why not just hold bonds? Such a portfolio would make sense if a recession is imminent, however that would involve investing in bonds when they are trading at the lowest yields in generations. Moreover, investors who shift all of their stocks into bonds risk selling at a bottom and losing the potential to recoup losses. Any allocation to stocks, of course, must vary with an investor’s tolerance for risk and need for funds in the near term. However, returns on both large-cap and small-cap stocks have been surprisingly high in times of tepid growth, rewarding investors willing and able to stand the volatility.
Within equities, a concentration in defensive and dividend-paying stocks. Within stocks, history suggests favoring dividend-paying companies and defensive sectors–Consumer Staples, Health Care, and Utilities. They provide the upside potential of equities and, in the case of dividend-payers, a cash flow to cushion any losses.
Within fixed-income, a substantial allocation to spread product, specifically investment-grade corporate bonds. Corporate bonds tend to preserve principal because they are much less volatile than stocks. But because their yields are higher than those on U.S. Treasury bonds–hence the term “spread product”–they provide investors with a higher return than Treasuries. Currently yields on corporate bonds rated Baa by Moody’s are trading at a spread of about 329 basis points over yields on 10-year Treasury bonds. This is much less than the 600 basis point spread at the height of the financial crisis in late 2008, but well above the 196 basis point average spread since 1962. In addition to attractive spreads, the higher yield of corporate bonds may benefit portfolios by providing a consistent income component that is received regardless of price movements, helping to cushion against market volatility.
Investments that help to cushion market volatility. With elevated volatility levels likely to continue, an investment that may benefit from heightened uncertainty helps not only to potentially improve returns, but also to help reduce portfolio risk. Alternative investment strategies may be potential sources of both diversification and some risk reduction.
Brian Gendreau
Market Strategist
Cetera Financial Group
This information is compiled by Cetera Financial Group from source material obtained or provided by U.S. federal and state departmental websites, equity index sponsors Standard & Poor’s, Dow Jones, and NASDAQ, credit ratings agencies Standard & Poor’s, Moody’s Ratings, Fitch Ratings, domestic and foreign corporate issued newswires and press statements, and from referenced compilations and index readings by Bloomberg Professional. The information is believed to be from reliable sources; however, we make no representation as to its completeness or accuracy. The information has been selected to objectively convey the key drivers and catalysts standing behind current market direction and sentiment.
No independent analysis has been performed and the material should not be construed as investment advice. Investment decisions should not be based on this material since the information contained here is a singular news update, and prudent investment decisions require the analysis of a much broader collection of facts and context. All economic and performance information is historical and not indicative of future results. Investors cannot invest directly in indices. This is not an offer, recommendation or solicitation of an offer to buy or sell any security and investment in any security covered in this material may not be advisable or suitable. Please consult your financial professional for more information.
While diversification may help reduce volatility and risk, it does not guarantee future performance. Additional risks are associated with international investing, such as currency fluctuations, political and economic instability, and differences in accounting standards.
Securities offered through Multi-Financial Securities Corporation, Member SIPC. DBA name is not affiliated with Multi-Financial.
Affiliates and subsidiaries and/or officers and employees of Cetera Financial Group or Multi-Financial Securities Corporation may from time to time acquire, hold or sell a position in the securities mentioned herein. |