2014 MID-YEAR Market OutlookMoving Into a New PhaseSince the end of the Great Recession, economists have repeatedly predicted that the United States would soon step onto a path of above-trend growth, only to see the economy slip into a slow-growth rut. For a while it appeared that pattern would be repeated in 2014. The consensus outlook began the year looking for above-trend growth, only to see real GDP fall by roughly one percent in the first quarter. To be sure, the unusually harsh winter had taken a toll on economic activity, but business investment was disappointing, and the recovery in the housing market had stalled on the back of a rise in mortgage rates. In late spring, however, monthly economic indicators — including those in labor and housing markets — started turning positive. It now appears that the first quarter weakness was indeed mostly weather-related, and the economy is in the early stages of a sustained period of growth at roughly a 3% pace. Now 3% growth does not seem especially strong. But the Congressional Budget Office now estimates the noninflationary GDP growth rate for the United States is 2.4%, which means even a 3% growth rate will eventually strain resource use, resulting in tighter labor markets, rising wages, and upward pressure on inflation and interest rates. While there is still some skepticism about the underlying strength in the economy, the question is increasingly one of not if, but when the U.S. and global economy will no longer need the life support of massive monetary stimulus. The current expansion has been subpar for so long that it is worth taking a moment to consider the signs of real improvement. First is the labor market. Economists agree that nonfarm payrolls are the single most accurate indicator of the health of the economy. Firms add new employees to their payrolls when they believe that the economy — and demand for their products — is on an upswing. Payrolls have been growing since the U.S. economy bottomed out in August 2009, but not at the 200,000-plus pace that would lead to a rapid decline in unemployment. In six of the past eight months, however, the economy has added more than 200,000 jobs per month. This is the kind of labor market performance that typically characterizes a solid expansion. Exhibit 1. The labor market continues to improve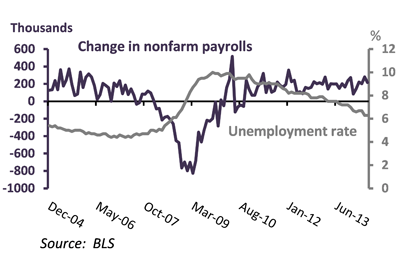
Second, there are signs that the housing market is coming back to life. The housing market had all but stalled out when mortgage rates rose after the Fed began tapering its large-scale bond purchases last year. Then in April and May, signs appeared that the housing market is improving. These include a jump in single-family home building permits, new and existing home sales, and home prices. (Housing starts in May were below expectations, but above 1 million units and 9% higher than a year ago.) A rebound in housing is important because activity in that sector has large spillover effects in other sectors of the economy, including building supplies, real estate brokerage, and furnishings. Third, manufacturing is picking up. Motor vehicle sales in particular rose to 16.7 million units in May (in contrast sales were 14 million two years ago at this time). Manufacturing no longer looms as large in the U.S. economy as it did a generation ago, but the services economy still follows the manufacturing sector, and the ISM nonmanufacturing index is up, with strong readings recently in new activity and new orders. To an extent the Fed has already responded to indications that the economy is strengthening. It has tapered its monthly purchases of Treasury bonds and mortgage-backed bonds from $85 billion to $35 billion as of June, with further tapering expected. But the market still believes an actual hike in the Fed funds rate is a long way off. In part this is because inflation is still low. The Fed's preferred inflation index, the Personal Consumption Expenditure index excluding food and energy (core PCE) is rising at a rate of only 1.42% over a year ago as of May — well below the Fed's 2% target. And considerable controversy surrounds whether the unemployment rate is a reliable indicator of labor market conditions. Much of the recent decline in the unemployment rate can be attributed to a decline in the labor participation rate, with more potential workers giving up looking for jobs. In addition, there is some doubt about whether the long-term unemployed exert the same upward pressure on wages and prices as those who are more actively seeking work. The Fed Funds options market is pricing in a 50% probability of a rate hike to 0.50% at the June 18, 2015 FOMC meeting (Exhibit 2), and higher probabilities of a tightening in policy in meetings after that date. In our view, the economy will prove to be strong enough to induce the Fed to hike rates before mid-year 2015. If the unemployment rate continues to decline at the same pace as in the past year, it will fall to 5% by June 2015. If so, enough evidence of upward pressure on wages and prices will appear to warrant a tightening move. Exhibit 2. The market is starting to price in a 2015 rate hike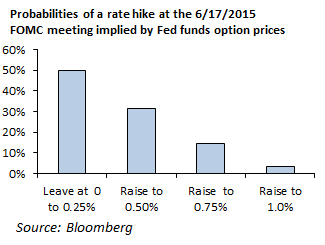
Currently, most major central banks around the world are still in the process of providing massive amounts of liquidity to the financial system, including (among others) the European Central Bank, the Bank of Japan and the Bank of England. But economists are already beginning to forecast a reversal of these policies. JP Morgan's team of global economists, for example, notes that the last move by 20 of the 30 central banks they follow was to ease monetary policy, but expects that for 19 of those banks, the next move will be to raise interest rates. How the markets react to the withdrawal of the extraordinary amount of liquidity by central banks is still an open question. Central bankers are confident they can unwind their large holdings of bonds without causing major market dislocations. Critics are not so sure. In our view, the most likely scenario is some turmoil as the markets come to accept the reality that interest rates will be higher sooner than expected. That turmoil, however, should be short-lived, as was the negative stock market reaction to the Fed's June 19, 2013 announcement that it would begin tapering its large-scale bond purchases. The stock market fell over 4% in the three trading days following the Fed's announcement, but recovered and as of this writing has risen 17.5% since that announcement. The reason the stock market's reaction to Fed tapering has been so benign is that the tapering is occurring in the context of a strengthening economy and robust corporate sector. Corporate earnings are at an all-time high, and are expected to continue to be strong. The consensus among equity analysts is that earnings of the S&P 500 companies will grow by 14% in 2014 and another 13% in 2015. Stock prices do not follow earnings in a lock step manner, but they do not stray from earnings for long either. Stock prices did run ahead of earnings growth last year, but in recent months have been more or less tracking earnings growth (Exhibit 3). In addition, the pace of M&A activity has been picking up lately (Exhibit 4). We expect both to continue to be sources of support for the stock market. Exhibit 3. Stock prices are again aligned with earnings growth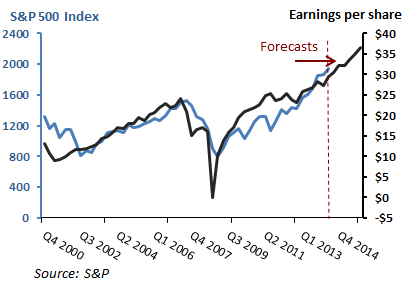
Because stock prices ran ahead of earnings growth, last year valuations in the stock market rose to levels that are close to their historical averages. The price-to-earnings (P/E) ratio for the S&P 500 companies based on consensus earnings estimates for 2014, for example, now stands at 17.2X according to Standard and Poor's, which is close to its historical average of 18.7X. To value-oriented investors this might suggest some caution is in order, but the current P/E ratio is still far below levels typically seen at market peaks. Exhibit 4. Stock prices are again aligned with earnings growth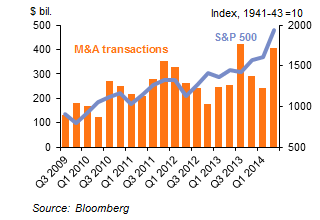
Investment implicationsFor the past several quarters our investment stance has been predicated on a weak but slowly improving economy. The risk, it now appears, is that the global economy will show greater strength faster than we — and the consensus — had expected. That risk is not so great, however, to warrant major changes in our investment recommendations. It is good to remember that the faster growth is still a matter of forecasts, and that it will be several months before confirmation arrives that the U.S. economy is moving into a late-cycle phase and that growth has picked up convincingly in Europe and developed Asia. Moreover, growth in most emerging economies — and increases in most commodity prices — will continue to be subdued until growth accelerates in the developed world and evidence accumulates that economic activity is picking up in China. Inexpensive valuations are harder to find in developed equity and bond markets. But it is too soon, in our view, to allocate toward the asset classes with the cheapest valuations, namely emerging markets and commodities. Our current stance can be summarized as follows: Maintain an allocation to equities. Within equities, favor international developed markets that stand to benefit from the expected improvement in their economic outlook. Stay slightly overweight in growth relative to value stocks. Limit exposure to long-term Treasury bonds. As central banks withdraw liquidity from the markets, interest rates are bound to rise. Keeping duration in the short to medium range should help limit any losses that may occur if rates rise by more than expected. The spread offered by corporate bonds should help in this environment too. Stay diversified. Alternative strategies have not all performed well lately, but are an excellent way to mitigate any volatility that may arise in the future. What to watch.When the facts change, views should change. What would induce us to change our views? Janet Yellen recently made the news by being explicit about the economic and market indicators that she and the Fed watch. We need to watch the indicators the Fed thinks are important because they are at the controls of some of the most important levers in the economy. Here are some of the indicators on Janet Yellen's dashboard, and two of our own: 1. Payrolls and the unemployment rate. The Fed has a dual mandate to achieve full employment and price stability. If the change in nonfarm payrolls drops below 200,000 per month for several months and the unemployment rate ceases to fall, look for a halt to the Fed's tapering and a longer wait for any hike in the Fed funds rate. 2. Treasury yields. The Fed — and all macroeconomists — keep a close eye on Treasury yields, which set the floor for the entire capital structure. Of special interest is the difference between the yields on 10- and 2-year bonds (2s/10s), which is driven by expectations about future interest rates. A sharp rise in yields would indicate that the bond market vigilantes have become worried about inflation and would likely elicit a tightening response from the Fed. Exhibit 5. Stock prices are again aligned with earnings growth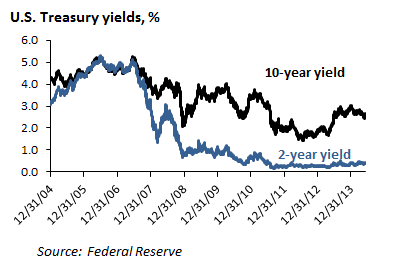
3. Inflation. The Fed's preferred inflation indicator is Core PCE — the Personal Consumption Expenditures price index ex. Food and Energy. Core PCE has been remarkably subdued, but rose slightly in May to 1.42% over a year ago. Watch for swift Fed tightening if it rises above the Fed's 2% target. Exhibit 6. Stock prices are again aligned with earnings growth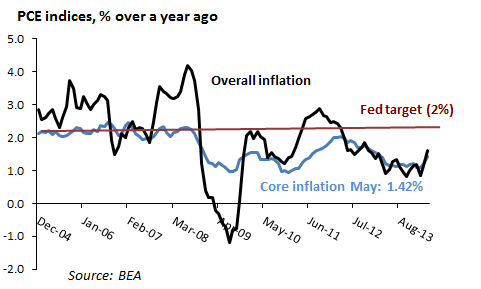
4. Long-term inflation expectations. The Fed watches "breakeven inflation" — the difference between yields on nominal 10-year U.S. Treasury bonds and 10-year TIPS, which is a market-determined measure of the inflation it expects over the next ten years. Recently 10-year breakeven inflation has been running around 2.2%, which is not too far out of line with the Fed's 2% inflation target. The Fed can be expected to react vigorously to any rise in breakeven inflation. Memories are still sharp of how difficult and painful it was to wring inflation expectations out of the economy in the 1980s. Exhibit 7. Stock prices are again aligned with earnings growth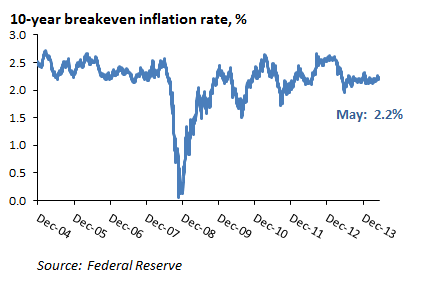
5. Market valuations. The two valuation indicators we watch most closely are the forecast P/E ratio for stocks and credit spreads measured as the yield differential between corporate bonds rated Baa by Moody's and the 7-year U.S. Treasury yield. The Fed does not target stock prices or valuations specifically, but has expressed more interest in countering asset market bubbles since the 2008 financial crisis. The P/E ratio for the S&P 500 is nowhere near bubble territory. Credit spreads are useful as indicating the degree of fear in fixed income markets (when high), and of the extent to which corporate bonds are attractive relative to Treasuries (at any time). Spreads have narrowed substantially over the past few years, but at 260 basis points for Baa-rated bonds still seem attractive to us, especially if higher yields are a possibility. Exhibit 8. Stock prices are again aligned with earnings growth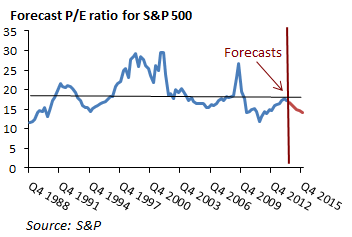
Exhibit 9. Stock prices are again aligned with earnings growth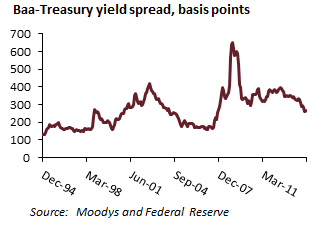
About Cetera Investment Management About Cetera Financial Group Committed to using its collective knowledge and expertise in service to and for others, Cetera Financial Group is focused on the growth of its affiliated broker-dealers and financial professionals' businesses by giving them the industry and market insight, technology, resources and solutions they need to better focus on helping their clients pursue their financial goals. For more information, visit cetera.com.
This information compiled by Cetera Financial Group is believed to be from reliable sources; however, we make no representation as to its completeness or accuracy. The information has been selected to objectively convey the key drivers and catalysts standing behind current market direction and sentiment.
|
Printed from: www.trustedfinancialadvisors.net